(R) 2표본 t검정(two sample t-test) 등분산 조건에 따른 계산 연습
1. 신약 효과 분석
혈압약에 대한 효과 분석을 위하여 Control(평상시) 그룹과 Treated 그룹으로 나누어서 혈압약을 일정기간 복용하였다. 혈압약의 사용이 혈압을 떨어뜨리는 효과가 있는지 유의수준 5%에서 검정하시오.
1) 귀무가설 vs 대립가설
귀무가설 : Treated 그룹의 혈압이 Control 그룹의 혈압보다 낮다.
$(\mu_t < \mu_c)$
대립가설 : Treated 그룹의 혈압이 Control 그룹의 혈압보다 같거나 크다.
$(\mu_t \geq \mu_c)$
2) 가정 체크 및 검정 방법 설정
control <- c(3.81,4.47,4.81,4.79,4.25)
treated <- c(3.93,4.26,3.74,3.61,3.93,4.36,3.93,3.89,4.03,3.85,4.06)
유의성 검정을 하는 것이므로 2표본 t검정을 실시한다.
2표본 t검정의 경우, 각각의 그룹이 정규성을 만족하고, 등분산 검정을
해야한다.
print(shapiro.test(control))
##
##  Shapiro-Wilk normality test
##
## data:  control
## W = 0.91285, p-value = 0.4849
car::qqPlot(control)

## [1] 1 3
qqPlot에서 모든 data가 영역안에 들어오고,
Shapiro 검정의 귀무가설은 ‘정규성을 만족한다.’ 이므로, 0.05 유의차로
검정했을때,
귀무가설을 기각하지 못하므로, 정규성을 만족한다.
print(shapiro.test(treated))
##
##  Shapiro-Wilk normality test
##
## data:  treated
## W = 0.95626, p-value = 0.7243
car::qqPlot(treated)
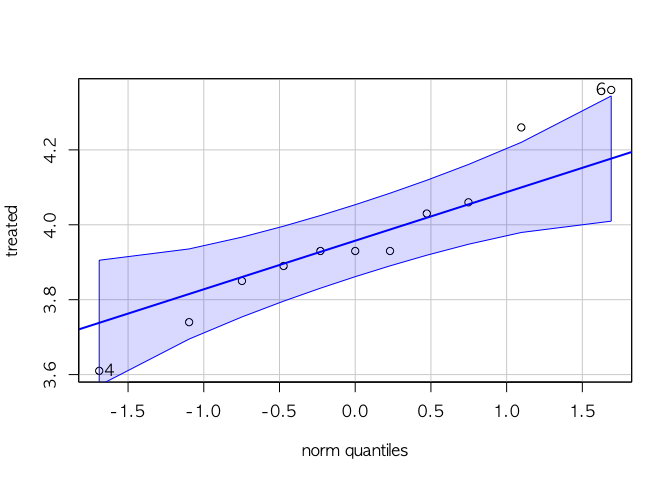
## [1] 6 4
오른쪽의 3점이 영역안에 들어오지 않지만,
shapiro 검정에서 귀무가설을 기각할 수 없으므로, 정규성을 만족한다고
생각한다.
2집단의 분산을 검정하는 방법으로, F검정을 한다.
var.test(control, treated)
##
##  F test to compare two variances
##
## data:  control and treated
## F = 3.8005, num df = 4, denom df = 10, p-value = 0.07901
## alternative hypothesis: true ratio of variances is not equal to 1
## 95 percent confidence interval:
##   0.850531 33.610843
## sample estimates:
## ratio of variances
##           3.800463
F검정의 귀무가설은 ‘두 집단의 분산이 같다.’ 이므로, 0.05의 유의수준으로 귀무가설을 기각할 수 없다. 따라서 ‘두 집단의 분산이 같다.’
두집단이 정규성을 만족하고, 등분산이므로 2표본 t검정을 실시한다.
t.test(control, treated, alternative = 'greater', var.equal = T )
##
##  Two Sample t-test
##
## data:  control and treated
## t = 2.9999, df = 14, p-value = 0.004777
## alternative hypothesis: true difference in means is greater than 0
## 95 percent confidence interval:
##  0.1912709       Inf
## sample estimates:
## mean of x mean of y
##  4.426000  3.962727
Two Sample t-test 의 p-value가 0.004 로 유의수준 0.05 보다 낮으므로,
귀무가설을 기각할 수 있다.
(alternative 값을 ‘greater’ 로 설정한다는 뜻은, 첫번째 값이 두번쨰
값보다 평균이 크다는 의미이다.)
귀무가설 : $\mu_c > \mu_c$
따라서, 대립가설인 control 그룹이 treated 그룹보다 평균이 크거나 같다.
$(\mu_c \leq \mu_t)$ 가 채택되며, 혈압약은 효과가 없다.
2. 고양이 소변의 효과
교양이 소변이 식물의 성장을 저해한다는 가설을 검정해보자. Treated 그룹은 고양이 소변을 식물에 뿌려주었으며, Control 그룹은 건들지 않았다. 한달 후 두 그룹의 성장 높이 데이터가 주어졌을때, 고양이 소변이 식물의 성장을 저해한다는 것에 대한 검정을 유의수준 5% 에서 수행해보세요.
control <- c(45,87,123,120,70)
treated <- c(51,71,42,37,51,78,51,49,56,47,58)
1) 귀무가설 vs 대립가설
귀무가설 : Treated 그룹의 높이가 Control 그룹의 높이보다 작다.
$(\mu_t < \mu_c)$
대립가설 : Treated 그룹의 높이가 Control 그룹의 높이보다 크거나 같다.
$(\mu_t \geq \mu_c)$
2) 가정 체크 및 검정 방법 설정
print(shapiro.test(control))
##
##  Shapiro-Wilk normality test
##
## data:  control
## W = 0.92451, p-value = 0.5594
car::qqPlot(control)
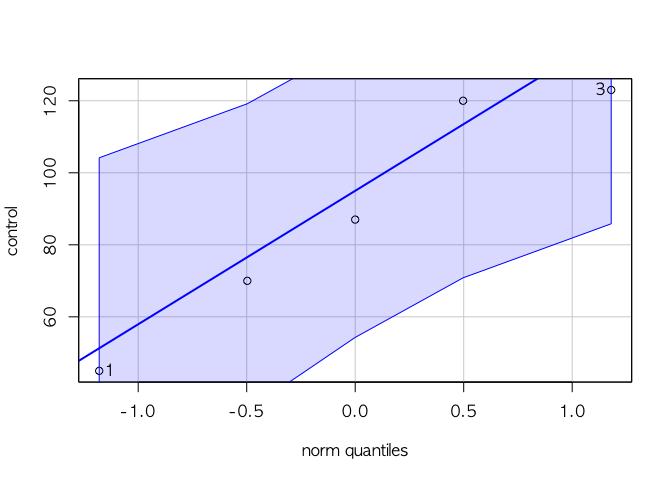
## [1] 1 3
qqPlot 영역에 data가 다 들어오고, shapiro 의 귀무가설을 기각하지 못하므로, control 그룹은 정규성을 만족한다.
print(shapiro.test(treated))
##
##  Shapiro-Wilk normality test
##
## data:  treated
## W = 0.91708, p-value = 0.2951
car::qqPlot(treated)
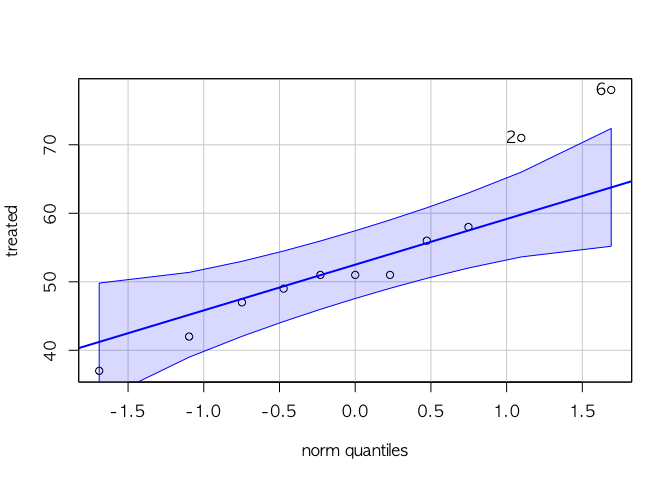
## [1] 6 2
오른쪽 2점이 qqPlot의 영역에 벗어나지만, shapiro 검정에서 귀무가설을 기각하지 못하므로, treated 그룹은 정규성을 만족한다.
2표본 t검정을 위한 등분산검정 실시
var.test(control, treated)
##
##  F test to compare two variances
##
## data:  control and treated
## F = 7.7881, num df = 4, denom df = 10, p-value = 0.008108
## alternative hypothesis: true ratio of variances is not equal to 1
## 95 percent confidence interval:
##   1.74296 68.87739
## sample estimates:
## ratio of variances
##           7.788141
F검정의 귀무가설은 ‘두 집단의 분포가 동일하다.’ 이다.
p-value가 0.05 유의수준보다 작으므로 귀무가설을 기각하기 떄문에, 두
집단의 분포는 다르다고 할 수 있다.
두 집단의 분포가 다르므로, welch’s two sample t-test를 실시한다.
t.test(control, treated, alternative = 'greater', var.equal = F)
##
##  Welch Two Sample t-test
##
## data:  control and treated
## t = 2.3069, df = 4.4744, p-value = 0.03767
## alternative hypothesis: true difference in means is greater than 0
## 95 percent confidence interval:
##  3.644362      Inf
## sample estimates:
## mean of x mean of y
##  89.00000  53.72727
p-value 가 0.03 으로, 유의수준 0.05보다 작다. 귀무가설을 기각하게 되고,
$\mu_c \leq \mu_t$ 인 대립가설을 채택하게 된다.
따라서, 고양이 소변이 식물의 성장을 저해한다는 가설은 틀렸다.
Leave a comment